Prior, Posterior, Sample
ch1
In more specific, it is the idea of Methods of Moments. This is the way of matching prior distribution to Xˉdistribution.
Conditional Independence
Bayes structure
(1) p(y∣θ)is the distribution of y conditioned on θ. Like Frequentist, Bayesian assumes a specific form of sampling distribution.
(2) p(θ)is the distribution of θ. From a bayesian point of view, parameter is not constant but random variable.
(3) p(θ∣y)reflects how strongly we believe our parameter.
Example

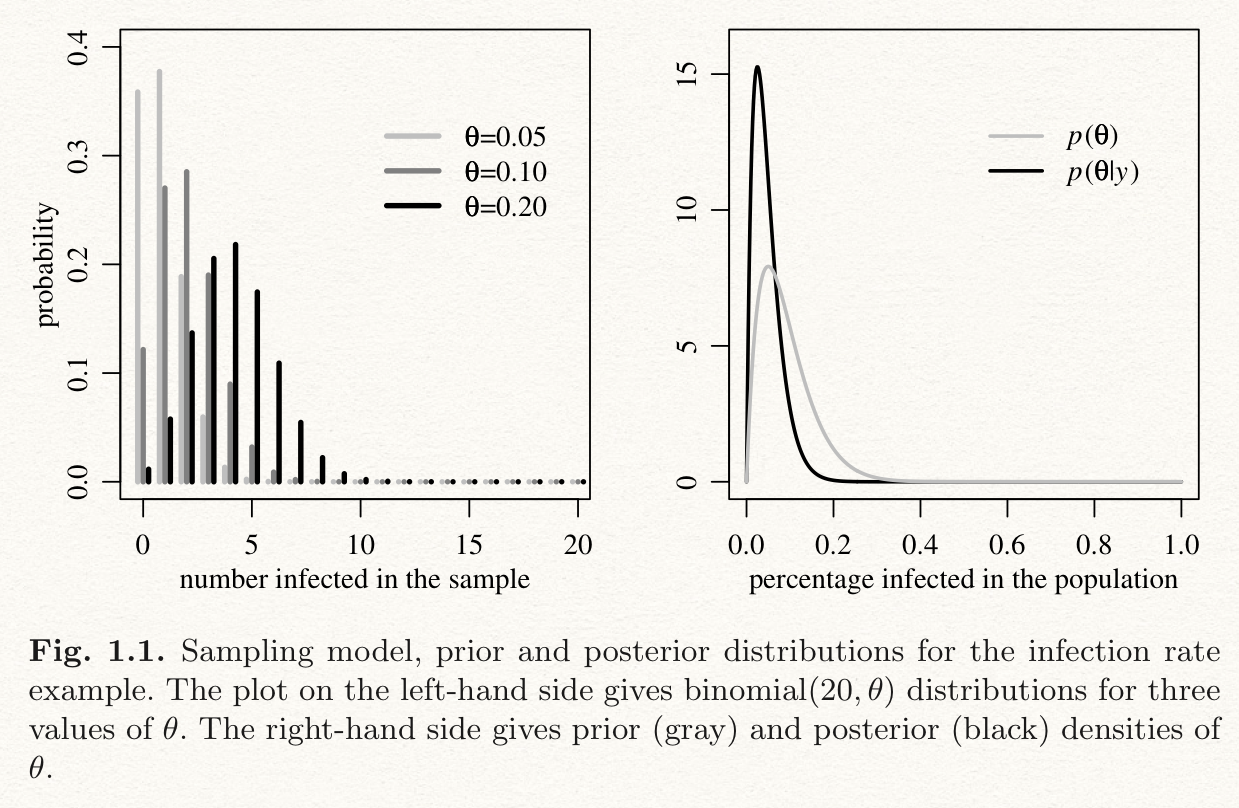
We want to investigate the infection rate(θ) in a small city. This rate impacts on the public health policy. Let's say we just sample 20 people.
Parameter and sample space
Parameter can be on parameter space, from 0 to 1 here. Data y means the number of infected people among 20.
Sampling model

Prior distribution
It is the information about the parameter we know using prior researches. Let's say infection rate has a range (0.05, 0.20) and mean rate is 0.10. In this case, the distribution of parameter would be included in (0.05, 0.20) and expectation should be close to 0.10.
There are a lot of distributions matching this condition, but we just select one distribution convenient in multiplying with sampling distribution(called conjugacy).
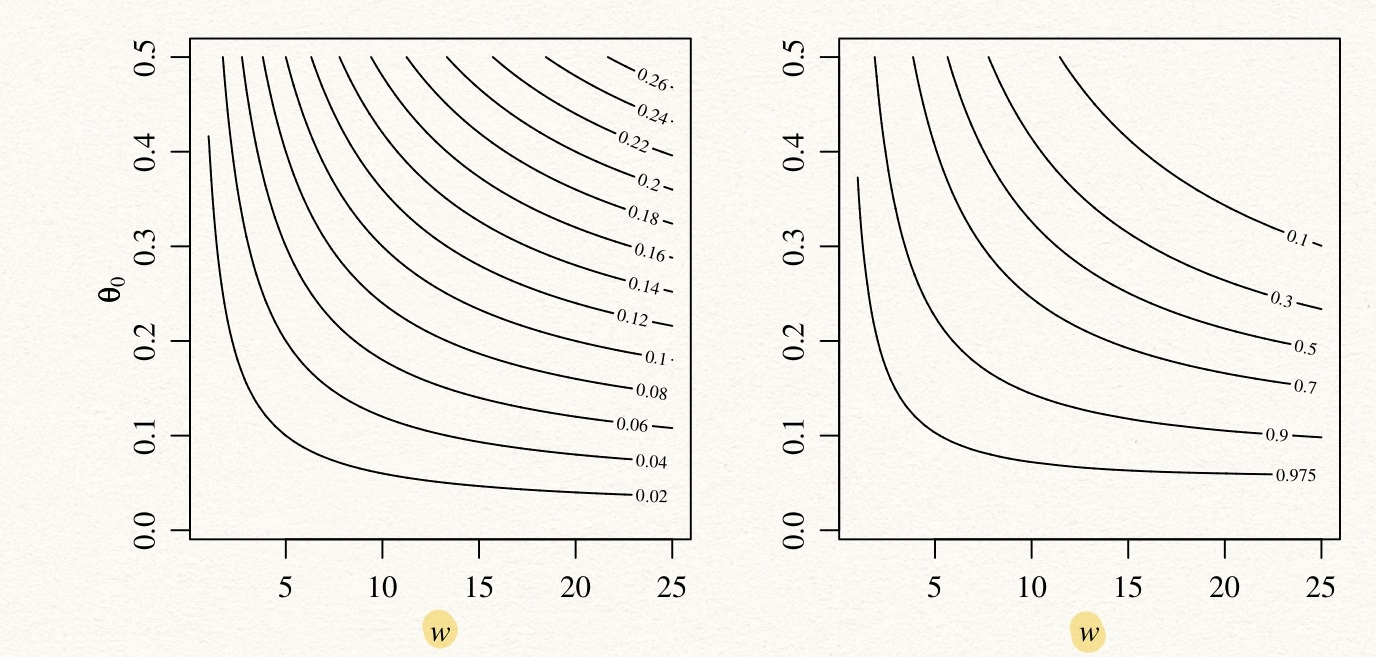
The sum of parameters a+b in beta distribution is equal to how much I believe the prior distribution. Because, when this sum becomes increased it shows a strong prior. Pr(0.05<θ<0.20)becomes bigger when the sum gets bigger.
Posterior distribution
We update the parameter information by multiplying Prior distribution with Sampling density.
We reflect {Y=0} as we observe this in sample.
Sensitivity analysis
θ0: prior expectation, yˉ: sample mean

Non-Bayesian methods
Make a variation.
Large sample, small sample 2 cases.
Bayesian estimate VS OLS in regression
It is the way of putting log-prior on β

OLS: Orthogonally project y onto the column space of X
Bayesian: Doesn't need to be orthogonal between error and xi
Last updated